HUMBOLDT’S NEW CURRENT
The practice of contemporary landscape architecture is fundamentally Darwinian in the sense that it relies upon systematic and quantitative observations of natural history for many of its design decisions. These observations often include temperature, rainfall, the chemical composition of the soil and air, the relationship between topography and plant and animal assemblages, and speculations on how these different interactions relate to one another and change over time. Today, however, the manner in which these observations are gathered has moved beyond the realm of lone investigators, who, like Charles Darwin and Alexander von Humboldt, spent years voyaging by sea or trekking through remote parts of the globe collecting rare specimens, jotting observations in journals, and in the process learning fundamental truths about self. Instead, much of the science of contemporary natural history resides within the realm of big data – an abstract world of numbers where information is tracked by remote-controlled instruments and then transformed into predictive models by networked computers.
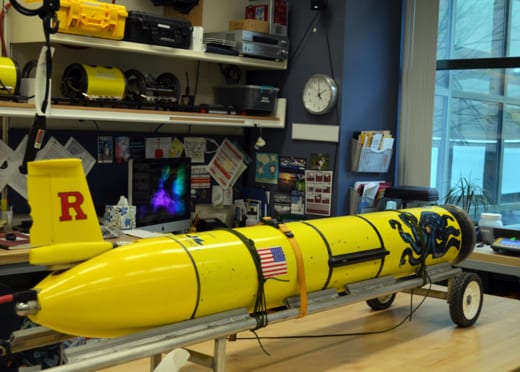
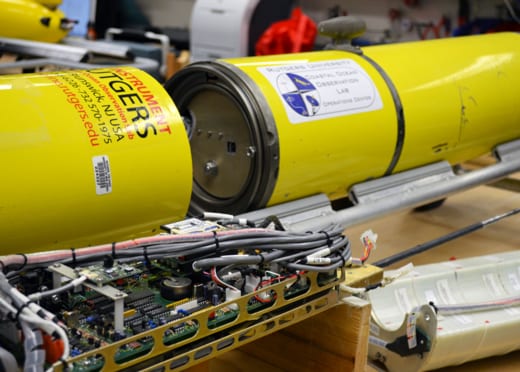
I was reminded of this the other day during a tour of the “COOL Room” at the Rutgers Institute of Marine and Coastal Sciences. COOL, which stands for Coastal Ocean Observation Laboratory, is the name of the Institute’s data collection center – a marine science information hub for the mid-Atlantic region that gathers oceanic and atmospheric measurements from of an array of space satellites, coastal radar installations, and neon-yellow torpedo-shaped gliders that float with the ocean’s currents (figures 1 and 2). The information collected by these high-tech instruments includes ocean temperature, salinity, currents, and sediments; underwater ocean vents and earthquakes: oxygen, chlorophyll, ocean plankton and algae blooms; and the day I was there, the migration pattern of a lone white shark as it slowly moved up the east coast of the United States.
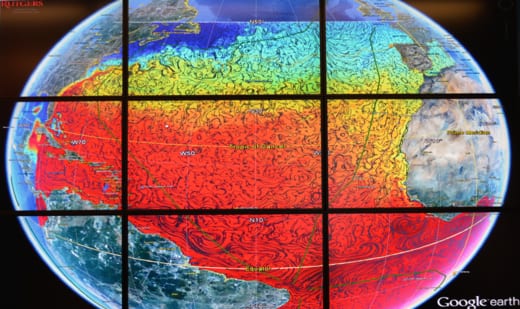
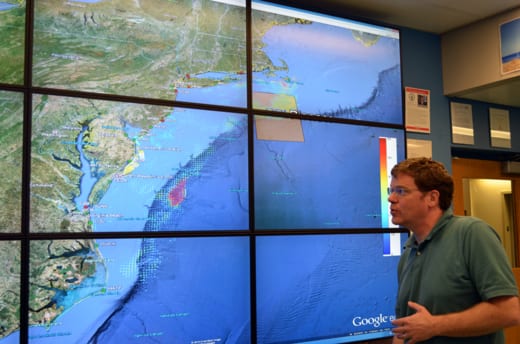
The panels that display this information consist of off-the-shelf, flat-screen monitors arrayed in a nine-square grid (figure 3). Brightly colored, visually striking patterns of information, which are projected upon a model of the world provided by Google Earth, cover the grid and light up the room. The patterns are updated daily, except in the case of hurricanes, when updates occur at one-hour intervals. Michael Crowley (figure 4), an atmospheric scientist specializing in satellite data and the Program Manager of the COOL Room, noted that the predictive models generated by the laboratory were crucial in predicting the storm surge for Hurricane Sandy, and were in fact more accurate than the land-based atmospheric models. This was due in large part to their ability to accurately monitor the relationship between ocean currents, temperature, and water turbulence — a critical factor in determining the relative strength of hurricanes.
Even though I was totally dazzled by the brightly colored data streaming across the COOL Room’s two large display panels, what actually captured my attention was a proposed two-year expedition of sixteen gliders that would re-create the nineteenth-century marine research voyage of the HMS Challenger. Originally a British Navy schooner, the HMS Challenger was a decommissioned battle ship made obsolete by advances in technology. After its cannons were removed, it was re-commissioned as the first oceanic marine research vessel. The natural-history voyage of the Challenger, made under the command of two captains and twenty-one naval officers, with a crew of 216 sailors (144 survived the voyage), was a 1,000-day circumnavigation of the globe and involved systematic measurements of water temperature, currents, ocean-depth, and plant and animal life. As noted on the National Oceanic and Atmospheric Administration (NOAA) web page, it took twenty-three years to compile the information collected during the almost 70,000-nautical-mile voyage of the Challenger into a fifty-volume report. In contrast, the data from the two-year synchronized voyages of the sixteen ocean gliders will be uploaded and transformed into projective models on a daily basis.
But perhaps the most intriguing aspect of my short journey into this modern-day digital landscape, where almost any question you can imagine is magically resolved by the touch of a finger upon a keyboard, was the fact that even though the world of big data has exponentially increased our knowledge of the world, its algorithmically derived consciousness has also, in some deeply and more elusive human sense, actively removed us from the terrain of self-knowledge championed by Darwin and Humboldt. Several of the young researchers in the facility reinforced this notion when they observed that they longed to get on a boat – to be out on the water traveling to a remote locale so that they could actually observe the gliders in action. But these trips, unfortunately, are expensive and often not funded by the agencies supporting the laboratory. I began to ponder how the Institute’s new way of communally but remotely gathering data informs our relationship to our surroundings and, hence, our understanding of self. Then I quietly wondered how future landscape historians would navigate this endless ocean of meta-data? And when they do, how will they and their machine counterparts describe the journey?